

Equity curve and By month
The curve shows how your account got to its result, and where it fell on the way.
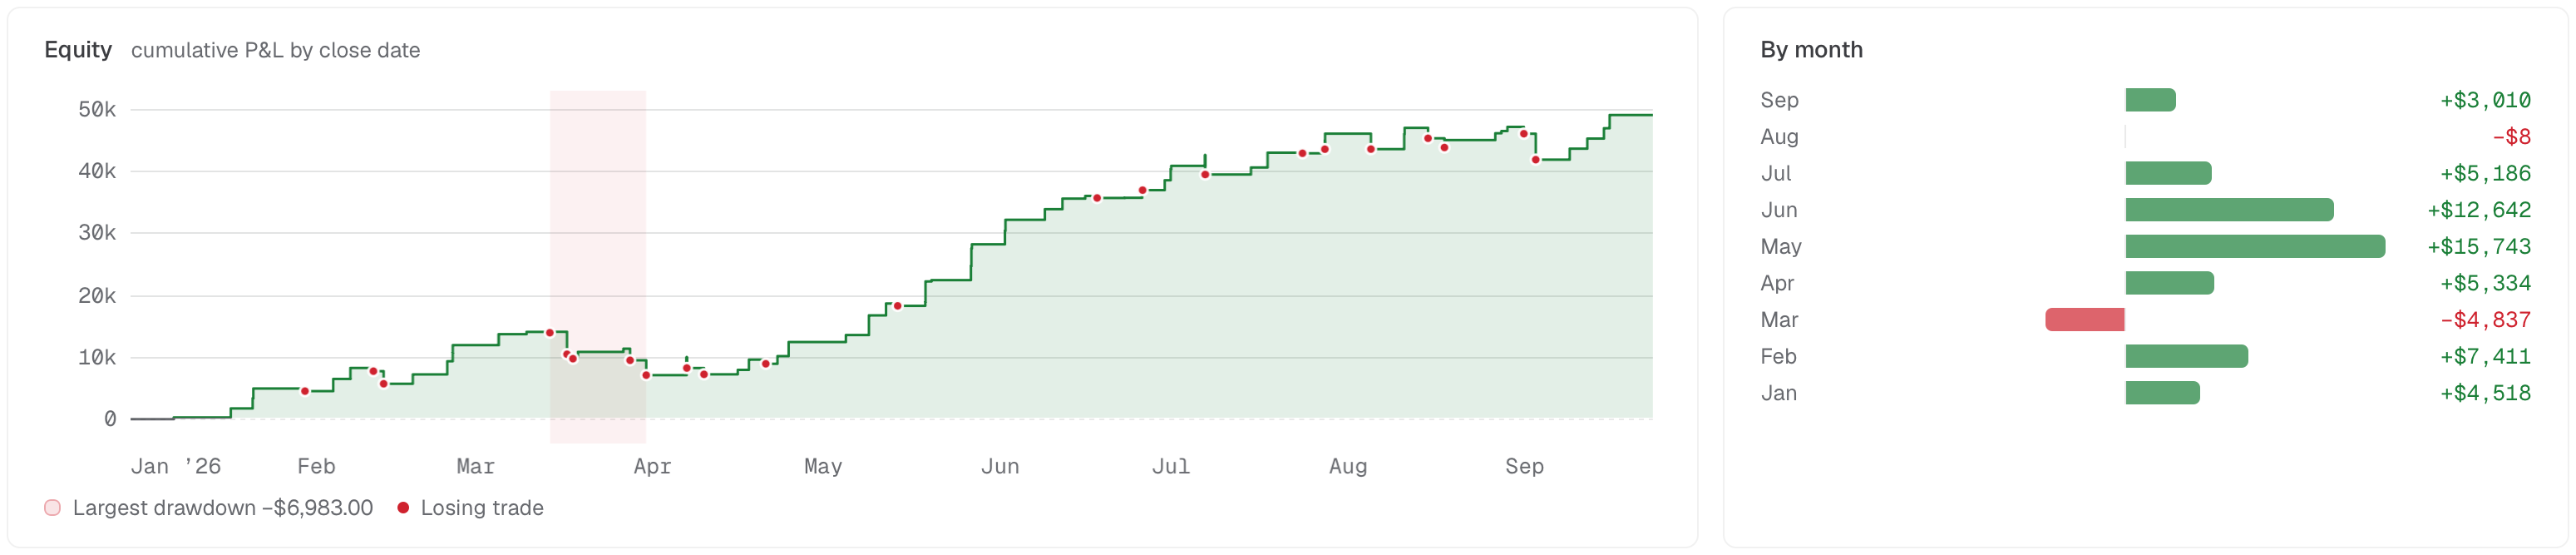
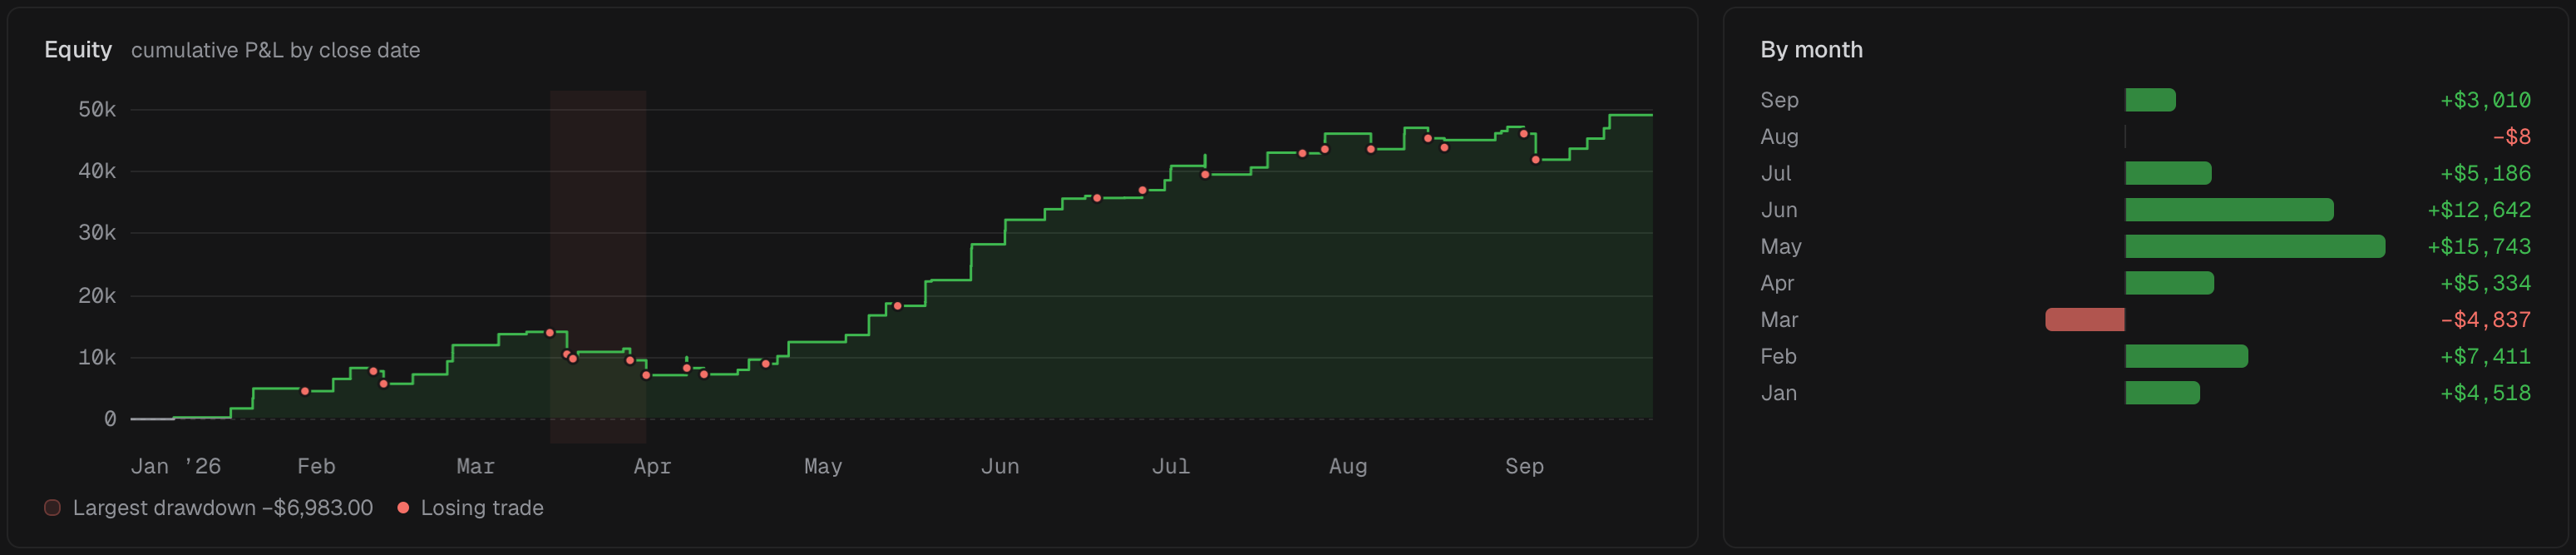
Cumulative P&L by close date, with the largest drawdown shaded.
- 1 Cumulative P&L
- 2 Largest drawdown
- 3 P&L by month
Equity plots cumulative P&L by close date. It steps at each close, is green above zero and red below, and shades the largest drawdown. Losing trades are marked with a dot when the period holds 200 trades or fewer. Hover the curve to read the nearest trade: its date, number, underlying, structure and P&L, and the running total.
By month shows the net P&L of each calendar month from the first close to the last, newest first, with a dash for months in which nothing closed.
Days and months follow Settings → General → Time zone, so a trade near midnight can land on either side of a month boundary. A trade is dated by its last fill; see Trade in the wrong month in Performance.