

Expected move
The expected move tells you how much room a trade’s strikes have. If a short strike sits inside the shaded 68% band, the model puts it within one standard move of today’s price.
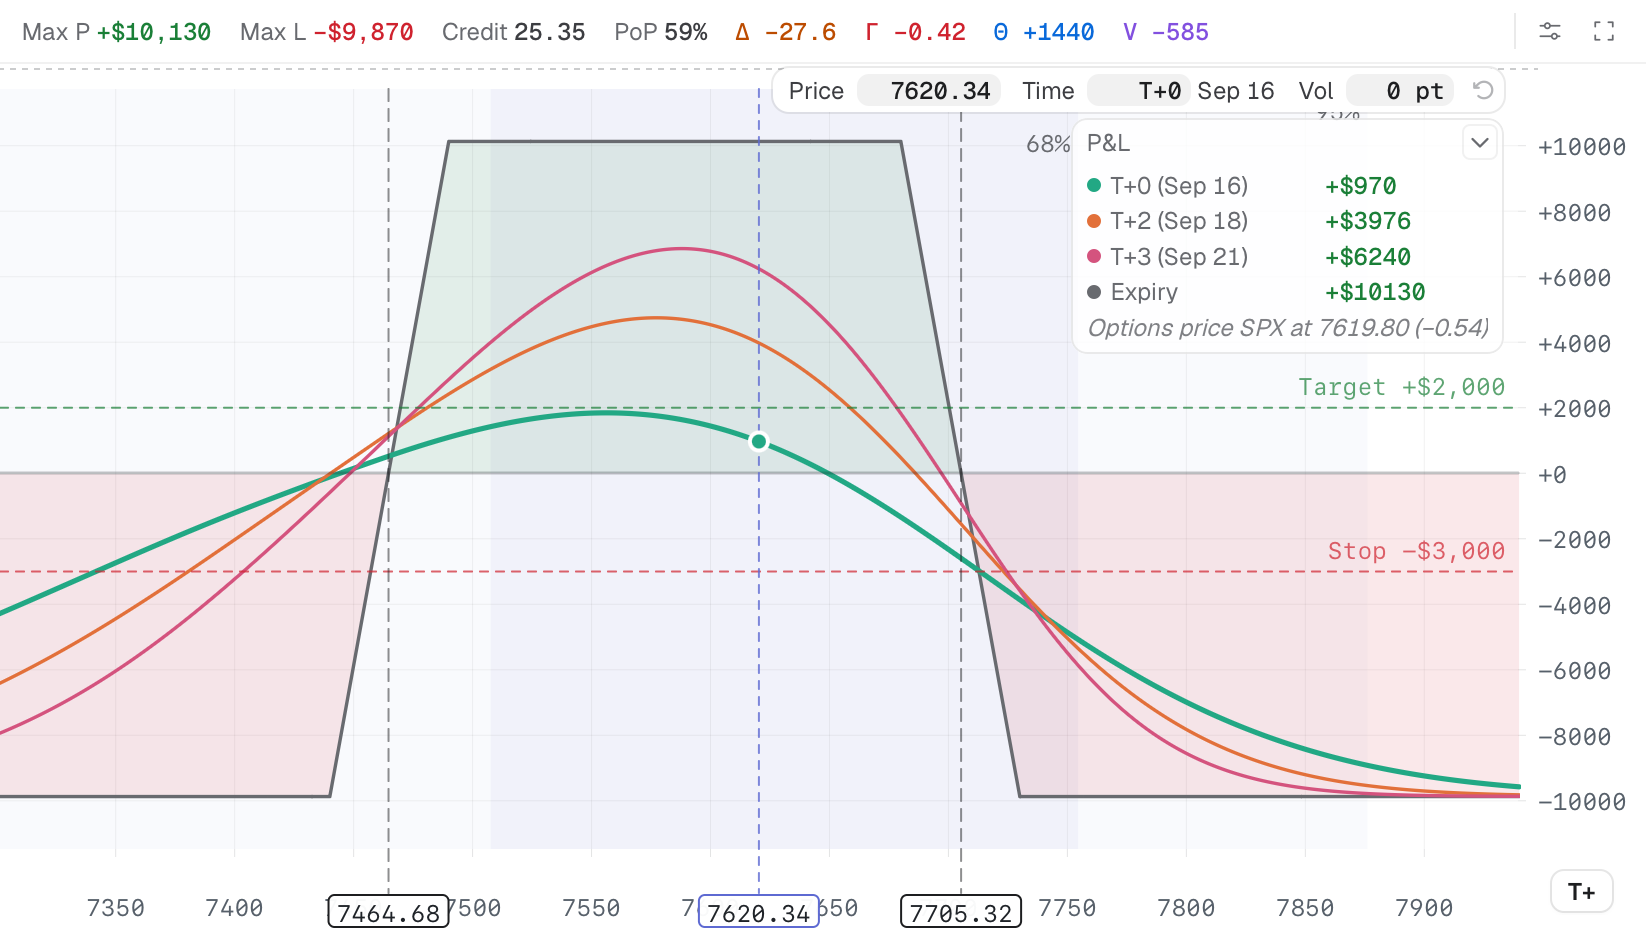
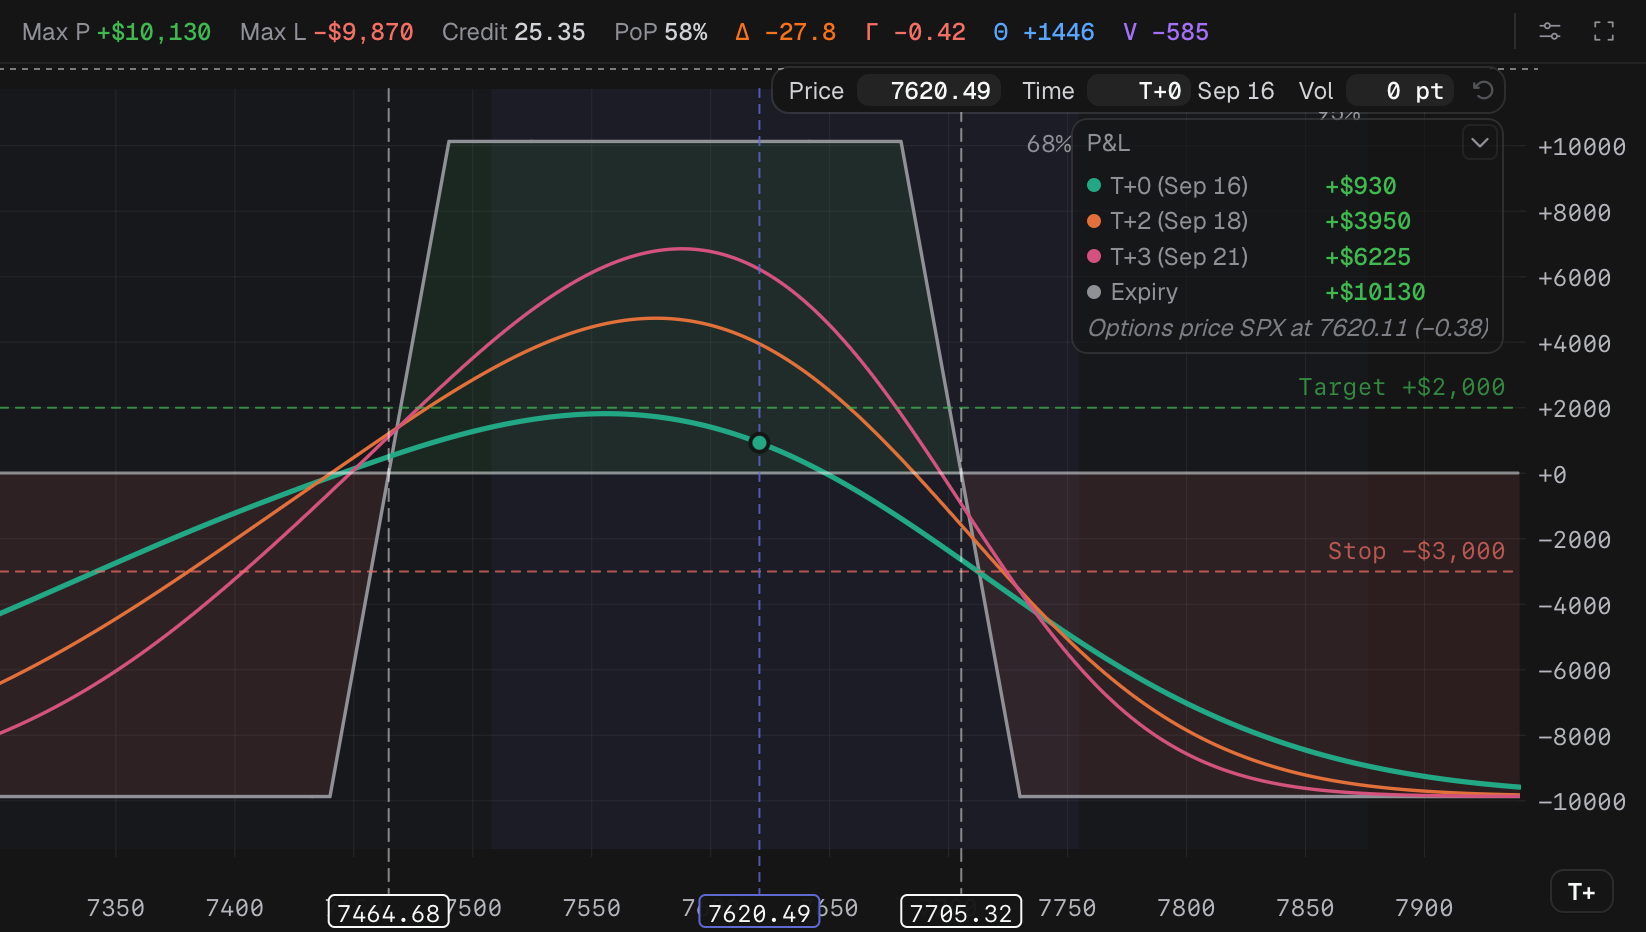
The 68% and 95% bands on the Sep 23 iron condor's graph, and the PoP they match.
- 1 PoP, same distribution as the bands
- 2 Curves at the band's spot
On the risk graph
Section titled “On the risk graph”The Expected move layer shades the range that holds 68% of the modeled prices and a fainter range for 95%, labeled “68%” and “95%”. It uses the same distribution as PoP, so on a smile the bands are not symmetric. It uses the front expiration only.
- Turn it on or off in Risk graph settings → Layers → Expected move, or in the right-click menu. It is on by default and applies to every graph.
- The PoP tooltip also gives the move in points, “One standard move: ±…”.
On the chain
Section titled “On the chain”The chain’s settings popover → Layers → Implied price distribution shades strikes by the expected move and shows “±N” beside each expiration in the expiration picker (hover: “Expected move (±1σ) by this expiration”). The chain uses the expiration’s own at-the-money IV and a 365-day year, so it can differ slightly from the graph’s front-expiration figure. See Option chain.